|
Welwyn Hatfield Parliamentary Constituency |
Index |
||
|
|
Introduction |
||
|
|
Introduction
Local newspapers
Welwyn and Hatfield Times
Welwyn and
Hatfield Review
Local government :
Hertfordshire County Council
Welwyn Hatfield District Council
European parliamentary zone
Eastern
Links :
www.statistics.gov.uk/census2001
neighbourhood.gov.uk : Stats on Wel.Hat.
www.welhat.gov.uk
www.election-maps.co.uk
Area Map/Constituency Border
Click on image for full size version.
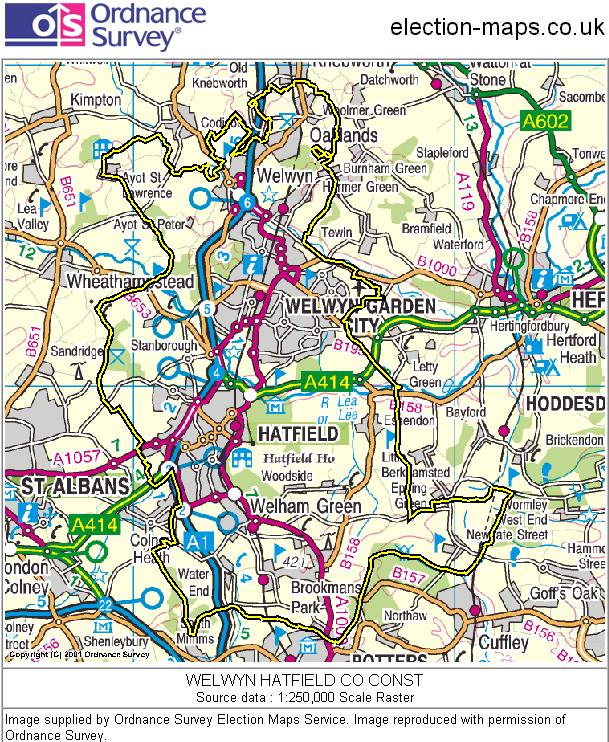
Image produced from the Ordnance Survey
Election-Map service.
Image reproduced with permission of
Ordnance Survey and Ordnance Survey of
Northern Ireland
Other Key Figures
Number of Households : 39844
Composition :
|
One person households |
11,437 |
|
Married couple households |
14,836 |
|
Cohabiting couple households |
3,198 |
|
Lone parent households: |
|
|
with dependent children |
2,276 |
|
with non-dependent children only |
1,176 |
|
All other households |
6,921 |
Average Household size : 2.39 people
----
Religion : Christian :68217, Hindu : 1035,
Muslim : 1106, 'No religion' : 17630
Age structure : Young people 0-15 : 19.173
Aged 75+ : 7,826
Area Summary
Welwyn/Hatfield -
twin Hertfordshire new towns, lying just along the northern edge of
Greater London.
Industry is primarily light, with a high dependence on the
service sector.
------------------------------------------------------------------------
All Data sourced via the office of National Statistics

Census day : 29 April 2001
------------------------------------------------------------------------
Election History
2001 Election
LABOUR HOLD - Melanie Johnson
|
Candidate |
Party/Affiliation |
Votes |
Share |
Change % on last vote |
|
Melanie Johnson |
Labour |
18484 |
43.2 |
-3.9 |
|
Grant Shapps |
Conservative |
17288 |
40.4 |
+3.9 |
|
Daniel Cooke |
Liberal Democrat |
6021 |
14.1 |
+0.6 |
|
Malcolm Biggs |
UK Independence Party |
798 |
1.9 |
n/a |
|
Fiona Pinto |
ProLife Alliance |
230 |
0.5 |
0.0 |
Stats Summary
Labour Majority : 1,196
Time of declaration: 2.48 AM
Turnout : 63.9%
Crusader Target : 1
Conservative target 17
Liberal Democrat target 128
1997 Election
LABOUR WIN - Melanie Johnson
|
Candidate |
Party/Affiliation |
Votes |
Share |
Change % on last vote |
|
Melanie Johnson |
Labour |
24936 |
47.1 |
+12.6 |
|
David Evans |
Conservative |
19341 |
36.5 |
-11.9 |
|
Rodney Schwartz |
Liberal Democrat |
7161 |
13.5 |
-3.2 |
|
E Cox |
Residents Association |
1263 |
2.4 |
n/a |
|
Ms H Harold |
ProLife Alliance |
267 |
0.5 |
n/a |
Summary : Labour Majority : 5595
Time of declaration: 4.27 AM
Turnout : 78.6
1992 Election
Conservative HOLD - David Evans
|
Candidate |
Party/Affiliation |
Votes |
Share |
|
David Evans |
Conservative |
29447 |
48.4 |
|
Raymond Little |
Labour |
20982 |
34.5 |
|
Robin Parker |
Liberal Democrat |
10196 |
16.7 |
|
E Lucas |
Natural Law Party |
264 |
0.4 |
Summary : Conservative Majority : 8465
Turnout : 84.4%
Winning party in previous elections
1987: Conservative
1983: Conservative
1979: Conservative
1974: Labour
------
Return to
Political Home
Last Updated : 08/10/04